It’s been a while. In August, I passed the CWNE exam and became number 641. A full post on that journey is coming. Before that: I had the Ekahau Sidekick 2 with me this morning before heading to a customer site and pulled live passive spectrum captures across all three Wi-Fi bands. I wasn’t planning on writing today, but the data was too good not to share.
Every conversation about moving clients to 6 GHz now has a live screenshot to back it up.
Watch the live capture
Three Channels. All of Them Saturated.
The IEEE 802.11 standard in North America allocates 83.5 MHz to the 2.4 GHz band. A standard 20 MHz channel requires roughly 25 MHz including guard bands. That means exactly three non-overlapping channels fit: 1, 6, and 11 (CWNP, “Certified Wireless Network Professional Study Guide”).
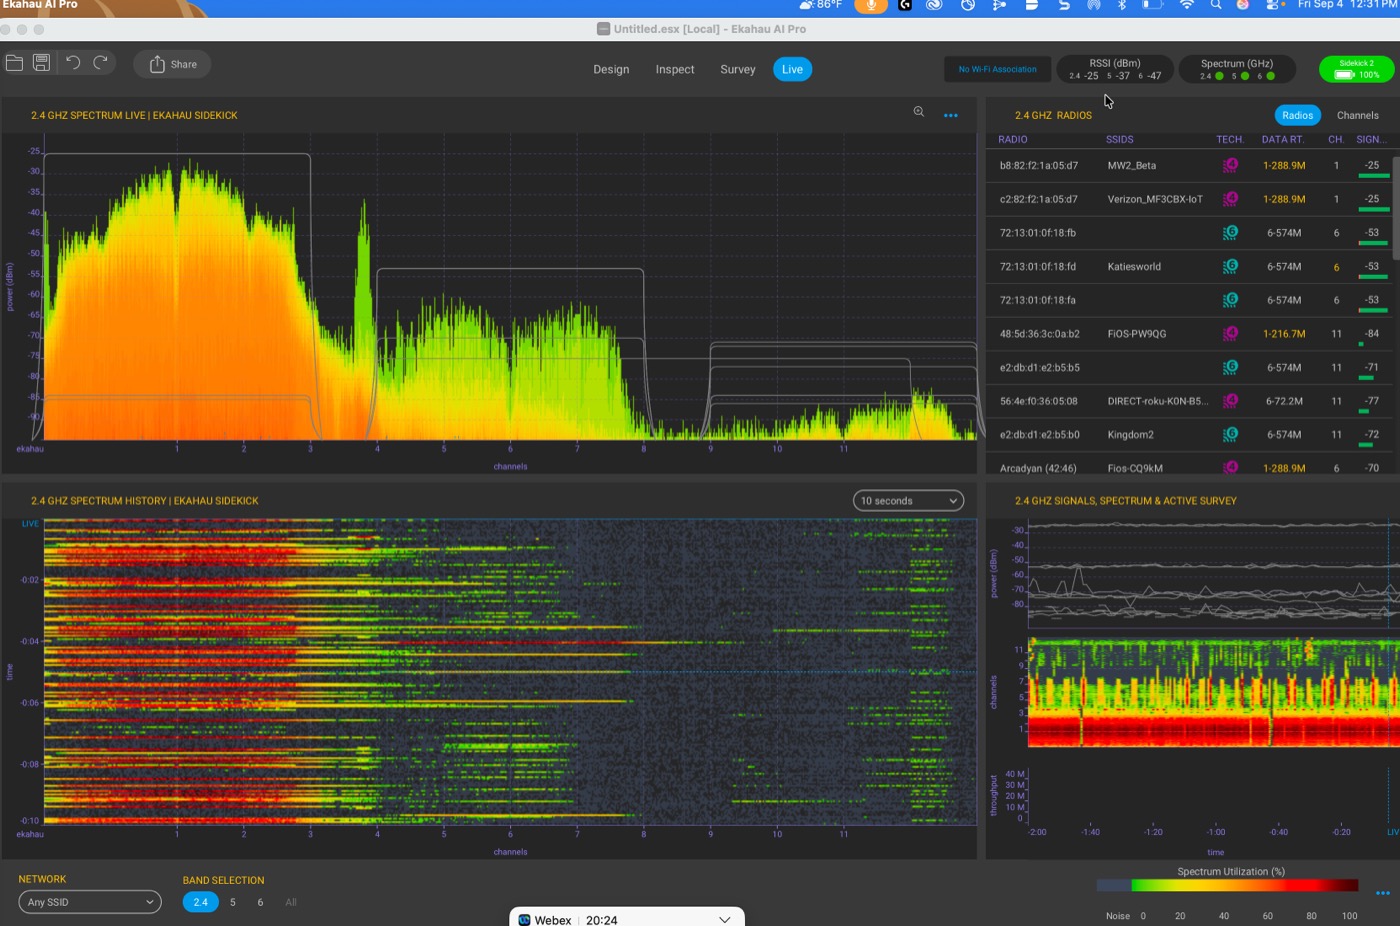
Figure 1. 2.4 GHz live spectrum and 10-second waterfall history. Channels 1 and 6 show sustained orange/red energy indicating near-total saturation. The right panel lists multiple SSIDs competing on each channel.
Three non-overlapping channels. Every Wi-Fi router, IoT device, baby monitor, and doorbell camera in your neighborhood picks one of them.
Look at the live spectrum view. Channels 1 and 6 are orange and red. In Ekahau’s heat scale, that color means dense, sustained RF energy. The waterfall history shows near-constant streaks across the 10-second window. The right panel lists the radios visible from my location: MW2_Beta and a Verizon MF3 IoT gateway on channel 1, Katiesworld on channel 6, FiOS and a Roku AP on channel 11.
That is a single passive capture from one location. When every neighboring network lands on the same three channels, co-channel interference raises the noise floor for everyone. Your SNR drops. Faster clients negotiate slower rates. The band punishes everyone equally.
More Room. Not Unlimited.

Figure 2. 5 GHz live spectrum, same capture session. Activity is scattered across channels 44, 104, and 132. The waterfall history is mostly dark compared to 2.4 GHz.
The spectrum history tells the story: mostly dark. Channels run from 36 to 165. In North America, the UNII-1, UNII-2, UNII-2e, and UNII-3 bands together deliver up to 25 non-overlapping 20 MHz channels. There is room to breathe.
But 5 GHz still carries legacy 802.11a and 802.11n devices. DFS channels require radar detection and can trigger unplanned channel changes. The non-DFS channels in UNII-1 and UNII-3 are filling in as more 802.11ac and 802.11ax clients accumulate. The issue is manageable. It is not solved.
5 GHz is the right answer for most deployments today. It is not the final answer.
1,200 MHz of Clean Spectrum.
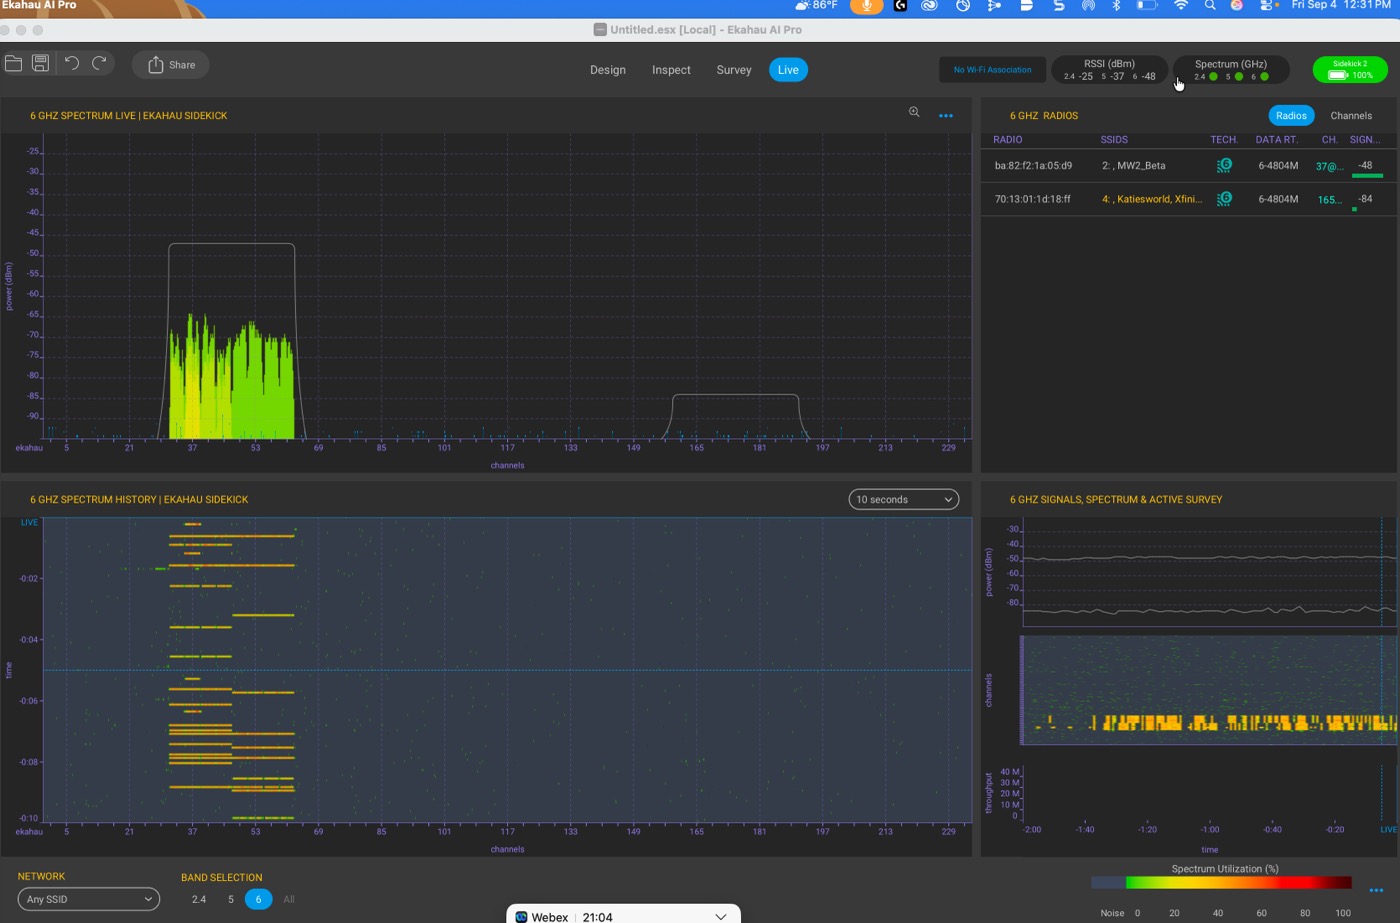
Figure 3. 6 GHz live spectrum. Two radios detected. The rest of the band is empty. Compare the waterfall density here to Figure 1.
In 2020, the FCC opened 1,200 MHz of spectrum in the 6 GHz band (5.925 to 7.125 GHz) for unlicensed Wi-Fi use (FCC, “Report and Order in ET Docket No. 18-295”). Wi-Fi 6E (802.11ax) and Wi-Fi 7 (802.11be) operate there.
That 1,200 MHz gives you 59 non-overlapping 20 MHz channels. Fourteen non-overlapping 80 MHz channels. Seven 160 MHz channels. Wi-Fi 7 can run a 320 MHz channel there. The math alone should make the case.
My Sidekick found two radios: MW2_Beta on channel 37 and a second AP near channel 165. Everything in between is nearly empty. The waterfall history shows occasional bursts, not the relentless saturation visible in Figure 1.
No Bluetooth. No DECT phones. No microwave ovens. No 802.11b or 802.11g devices dragging down multicast rates. Only Wi-Fi 6E and Wi-Fi 7 radios can access this band. Every client connecting to a 6 GHz SSID is a capable, modern device, by definition.
The noise floor in 6 GHz reflects what the band actually is: 1,200 MHz of quiet spectrum that nobody has had time to fill yet. Design into it now.
Live RSSI from the same passive capture. A stronger signal means more RF energy competing in that band. 6 GHz is quieter by design.
Five minutes of passive capture before the site visit this morning told a complete story. No slides required. If you are advising customers on wireless architecture, live spectrum data from a Sidekick closes more conversations than any vendor white paper.
The full live capture video is on YouTube now. I walk through the Ekahau interface, explain what the spectrum colors mean, and cover the channel planning decisions you make from data like this.
All three bands, live. Ekahau spectrum colors explained. Channel planning commentary throughout.
Watch on YouTubeShare This Post
Works Cited
- CWNP. Certified Wireless Network Professional Study Guide. CWNP, 2023.
- FCC. “Report and Order in ET Docket No. 18-295.” Federal Communications Commission, Apr. 2020.
- Ekahau. “Sidekick 2: Wi-Fi Spectrum Analyzer.” Ekahau Inc., 2024, http://www.ekahau.com/products/sidekick/.